The Housing Market Is Frozen, Not Broken

GDP and Housing: Remember, One Quarter A Trend Doesn’t Make
The economy grew 1.5% in the second quarter, down from 2.1% in the first and below the 1.8% economists expected (BEA). Cue the headlines about a stalling economy.
“Ah the economy is tanking we are headed for recession…maaaaaaa!”
Not so fast.
One quarter is a single data point, and single data points have a habit of being noisy lies.
Further, let’s not stare at the rearview mirror, but instead look through the windshield: the Atlanta Fed’s GDPNow model, which tracks incoming data in real time, opened its third-quarter estimate at 5.0% (Atlanta Fed, via MarketScreener). The tracker appears to be pointing at reacceleration, not recession.
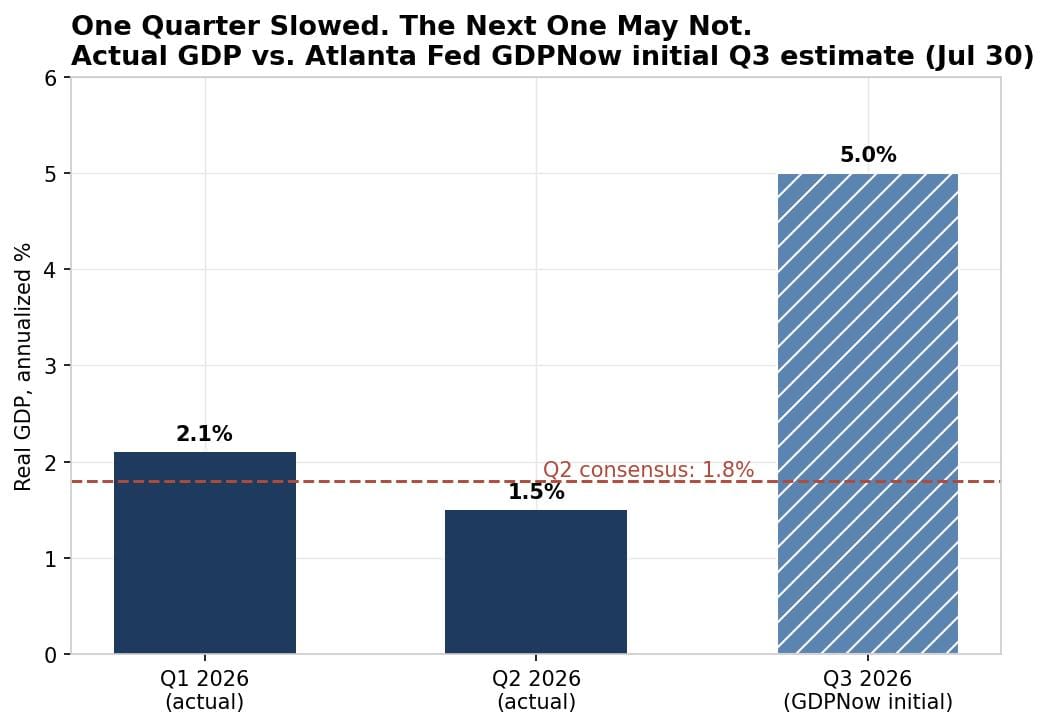
Sources: BEA, Atlanta Fed GDPNow.
The bond market seems to agree that growth is not collapsing: the 10-year Treasury yield has climbed from about 4.40% at the end of June to 4.69% (Deloitte; MND). Yields generally do not rise like that when investors smell recession.
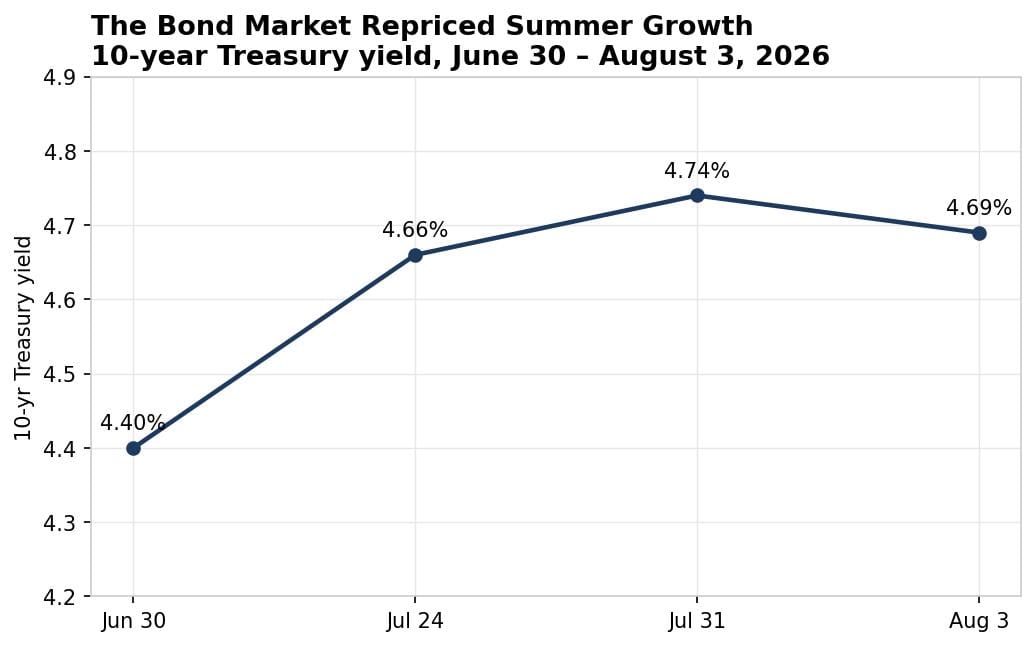
Sources: Deloitte weekly economic update, Mortgage News Daily.
The steelman: The counterpoint? The slowdown case is not totally crazy. GDPNow’s opening estimate for any quarter is built on thin data and swings hard as the quarter fills in, so 5.0% is a direction, not a promise. Consumer spending growth did cool in Q2. And the growth that remains is increasingly concentrated in one theme: AI capital spending. If that spending pauses, the economy may be softer underneath than the headline suggests. Fair points, worth watching.
But a forecast built on one weak quarter, against a real-time tracker pointing the other way, is not analysis: it’s emotion.
The lesson, and it’s the theme of this whole issue: one number is noise. Trends are signal.
Inflation Will Keep Cooling Regardless of Middle East Action
The Fed’s preferred inflation gauge came in tame again in June: core PCE rose 3.3% year over year, and the headline measure actually fell 0.1% for the month (BEA). Core CPI sits at 2.6% (BLS). The trend has been one direction, down, for months.
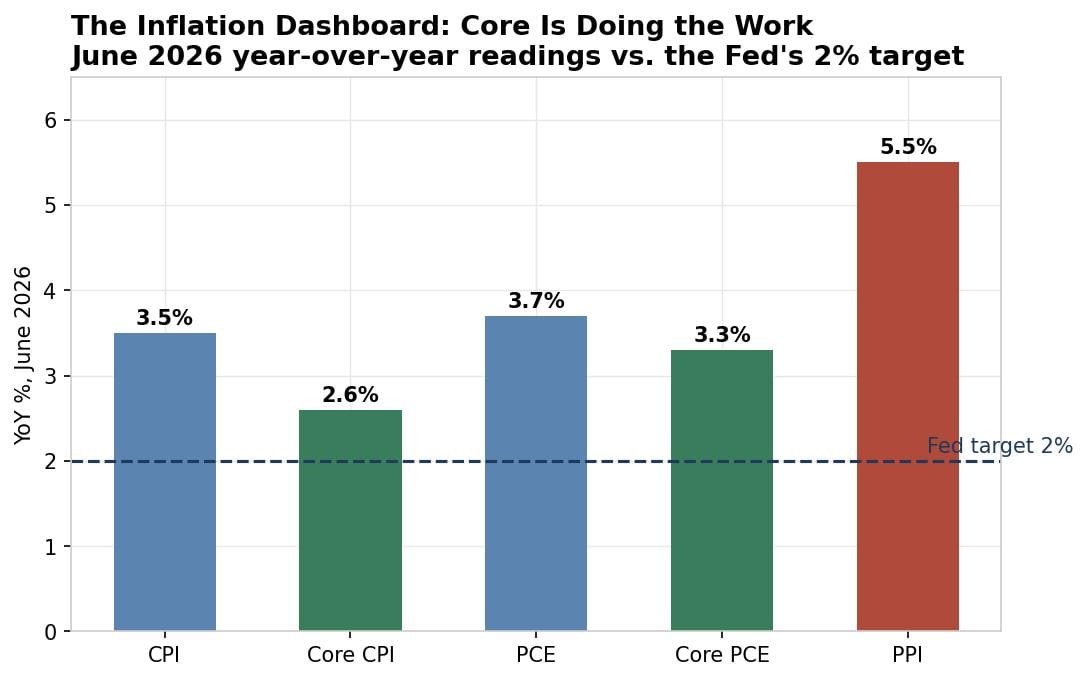
Sources: BLS, BEA.
The one genuine threat to that trend was oil. Crude spiked from roughly $69 at the start of July to nearly $90 mid-month on Hormuz and Red Sea fears, and that spike was leaking into mortgage rates and inflation expectations.
This will remain volatile, and that is just fine. A healthy sign in a healthy market.
This week starts with another move down: WTI dropped about 5% on Monday to roughly $80 as diplomacy between Washington and Tehran gained traction and tanker traffic recovered (MarketScreener).
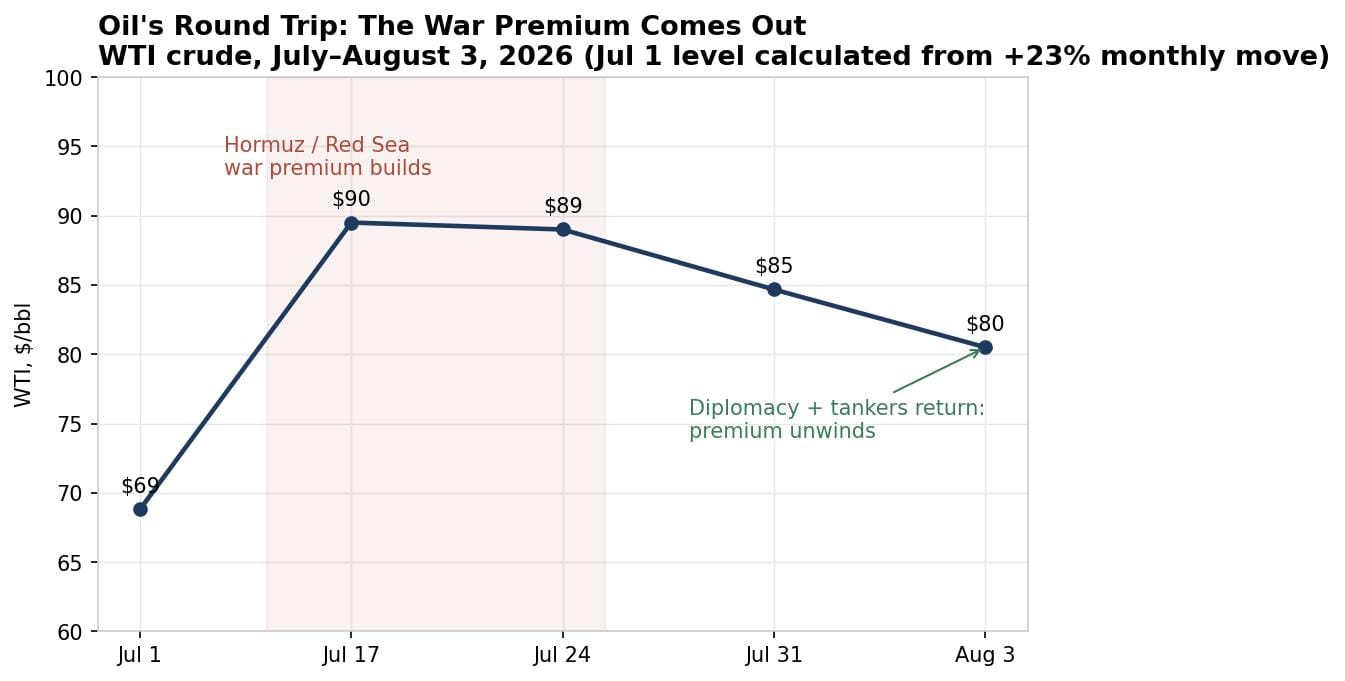
Sources: Trading Economics, MarketScreener. July 1 level calculated from the reported 23% monthly move.
I’ve been arguing since the spring that energy is the swing factor in this inflation cycle, first in Inflation Reset and before that in Energy Prices Have Peaked. Rents Are Turning.
And once the war premium stays out of crude, the last real obstacle between the Fed and lower rates will dissolve.
The steelman: Counterpoint?
Of course inflation is not beaten. We are, and will be for years to come, in a long COVID / zero interest rate / free money etc…. hangover.
This is what injecting $10+ trillion into the economy does.
Producer prices are still running 5.5% year over year (BLS), headline PCE is 3.7%, and three Fed officials were worried enough to dissent in favor of a rate hike at last week’s meeting, where the committee held at 3.50–3.75% on a rare 9–3 vote (CNBC). And oil diplomacy can fail as fast as it started. If crude re-spikes, this paragraph ages badly. That’s the honest risk.
But notice the pattern again: the hawks are reacting to where inflation has been. The forward indicators, cooling core, falling crude, appear to be pointing much friendlier.
That Scary Home-Sales Number? Noise.
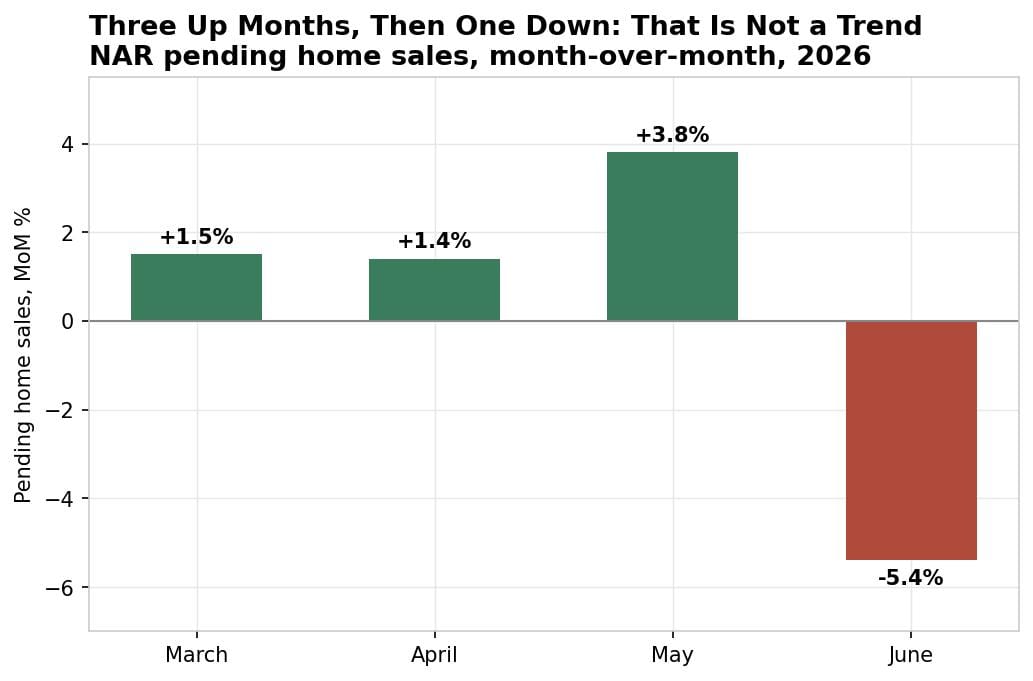
You may have read this last week that pending home sales fell 5.4% in June, the biggest monthly drop of the year, with contract signings down in all four regions (NAR).
Spooooooooky.
Sounds ominous.
But don’t fret.
Here’s what most coverage left out: it followed three straight up months. March rose 1.5%, April 1.4%, May 3.8% (NAR March, April, May).
Source: NAR pending home sales reports, 2026.
My rule: one month of housing data is noise. Two months in a row, start paying attention. Three months, now it means something. June is one month.
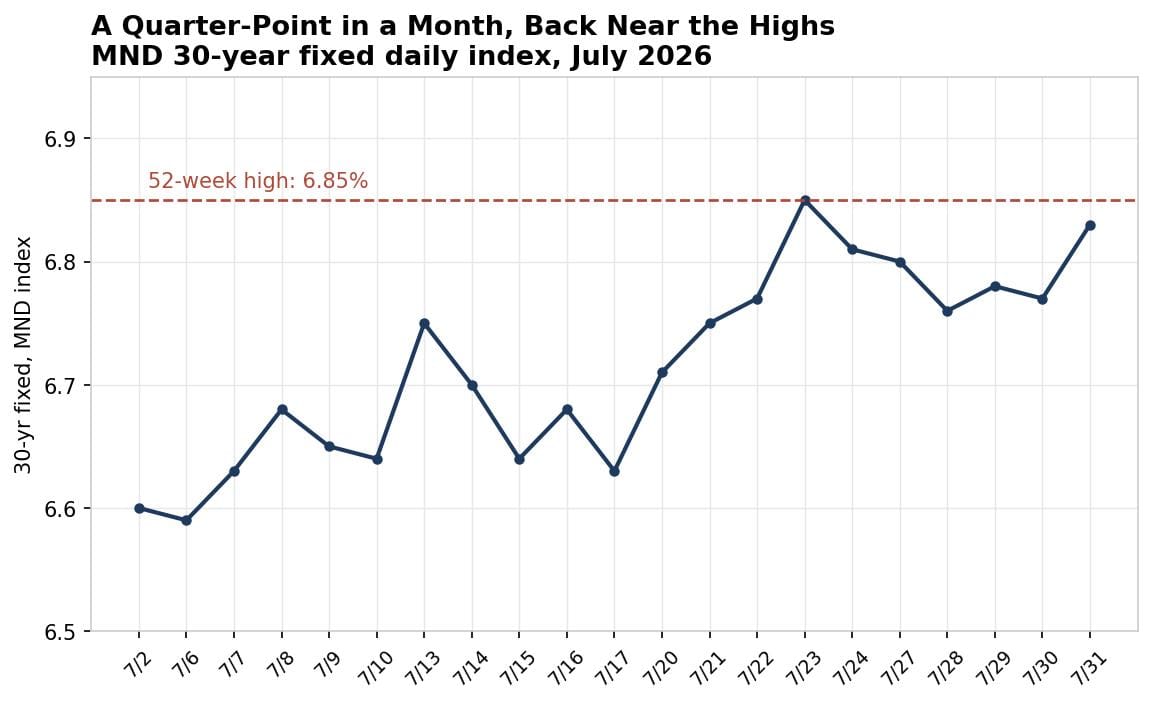
What likely caused the dip is no mystery. Mortgage rates spent July climbing a quarter point, from 6.59% to 6.83%, back within a whisker of their 52-week high of 6.85% (Mortgage News Daily). NAR’s chief economist Lawrence Yun named it plainly: “the highest mortgage rates in nearly a year and the record-high national median home price” (NAR).
Source: Mortgage News Daily daily rate index.
So if one down month is noise, what’s the signal? Glad you asked. That’s the deep dive this week.
The Great Freeze: Three Years at Four Million
Here is a number that is not noise.
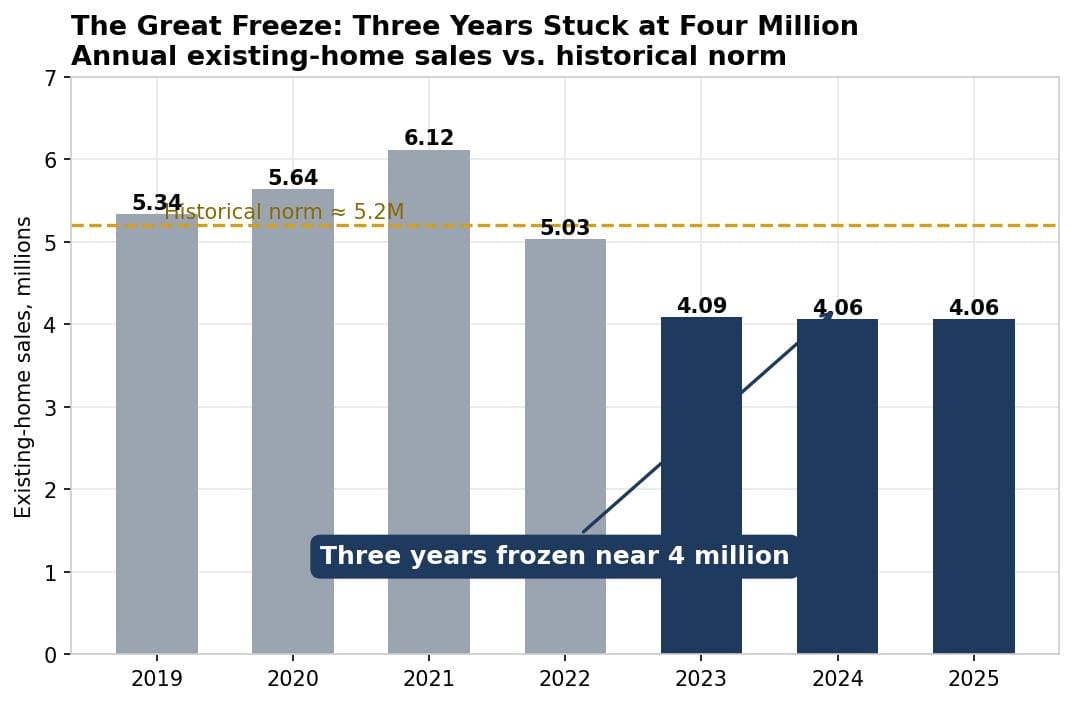
Americans bought 4.09 million existing homes in 2023. Then 4.06 million in 2024. Then 4.06 million again in 2025 (Fannie Mae). The historical norm is around 5.2 million. Three straight years, roughly a quarter of the market’s normal transaction volume, gone.
That is a trend.
That is signal.
Sources: NAR annual data, Fannie Mae. (2019–2022 figures from NAR historical releases.)
And here’s the strange part: prices never fell. The median existing home sold for a record $440,600 in June, the 36th consecutive month of annual gains (NAR). Record prices, dead volume. Most people assume those can’t coexist. They’ve now coexisted for three years.
Why Nobody Moves
The mechanism is brutally simple: the monthly payment.
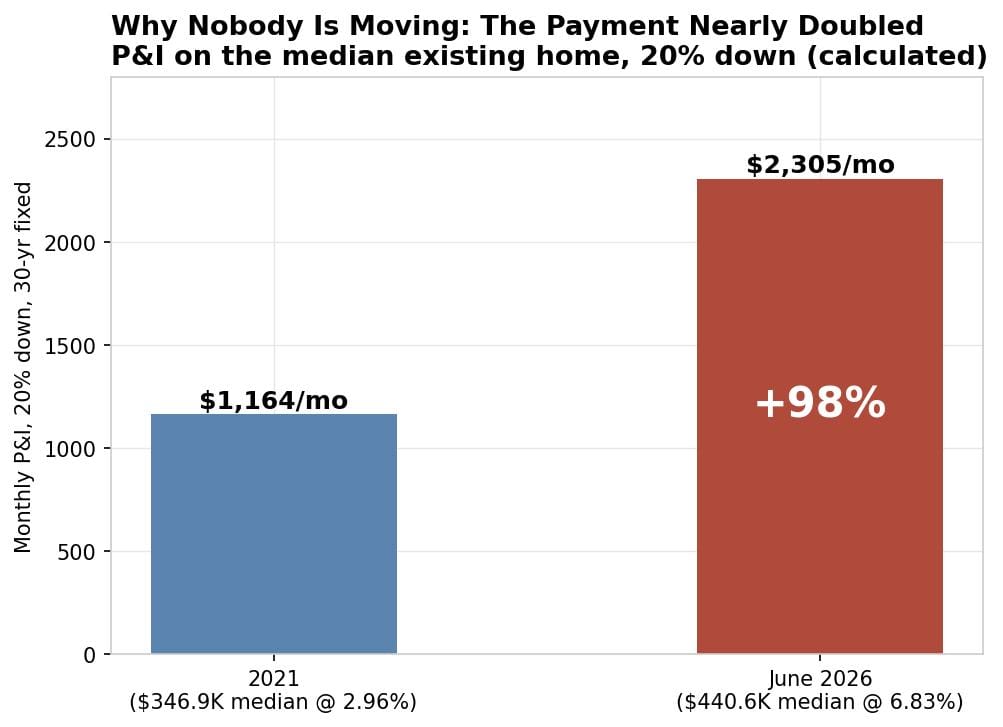
In 2021, the median existing home cost about $346,900 and a 30-year mortgage ran about 2.96% (NAR; Freddie Mac). Put 20% down and the principal-and-interest payment was roughly $1,164 a month (calculated).
Today the median is $440,600 and the rate is 6.83%. Same 20% down: roughly $2,305 a month(calculated).
The payment on the median American home appears to have nearly doubled, up 98%, in five years (calculated).
Sources: NAR, Freddie Mac, MND. Payments calculated: 20% down, 30-year amortization.
That doubling froze both sides of the market at once. Buyers can’t stretch to the payment. And sellers, roughly speaking, ARE buyers: most people who sell must then buy at the same prices and the same rates, while surrendering the 3% mortgage they locked in years ago. So they don’t sell. Volume dies, but because nobody is forced to transact, prices don’t fall. The market doesn’t crash. It simply stops.
Washington’s response to all this, by the way, was the ROAD to Housing Act, which I covered two weeks ago in The Apartment Glut Is Going Keto: a law aimed at a villain who owns about 1% of the housing stock. The freeze has nothing to do with Wall Street. It’s arithmetic.
What Breaks the Ice
Three levers could thaw this market. Watch them in order.
Lever one: rates. Fannie Mae’s July forecast has the 30-year averaging 6.4% through 2026 and easing to about 6.3% in 2027 (Fannie Mae). My own view, which I laid out in Why I Think the Next Fed Move Is a Cut, is that fading oil inflation eventually lets the Fed cut more than consensus expects, and this week’s crude unwind is the first live evidence. Somewhere between 5.5% and 6%, the payment math starts working again for millions of households.
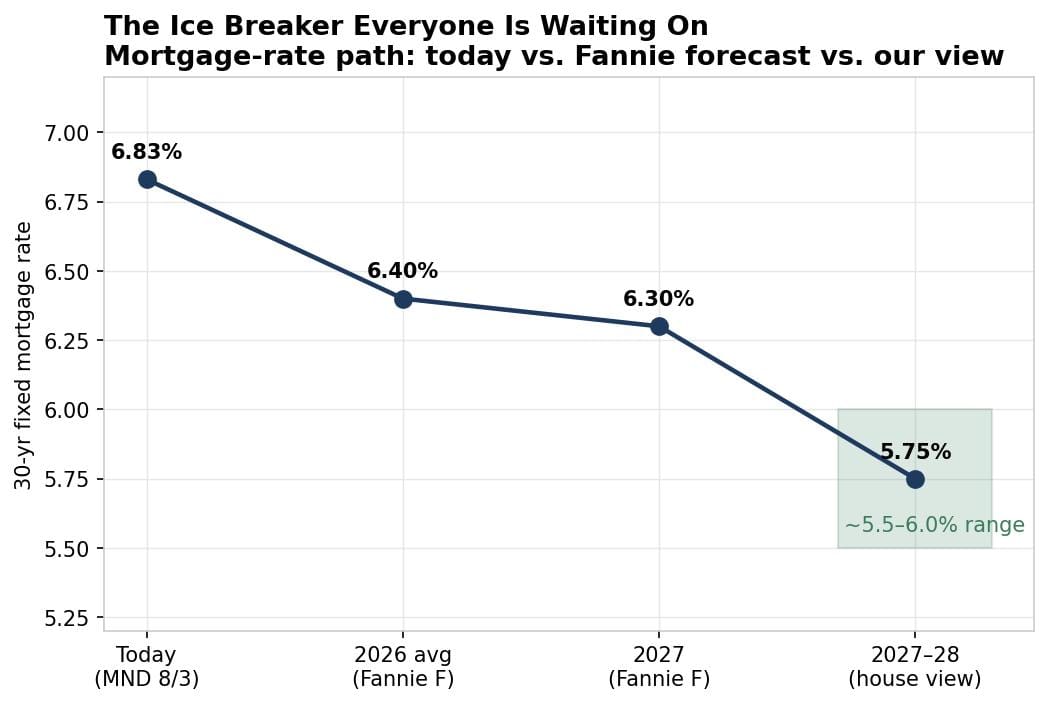
Sources: MND, Fannie Mae forecast; the 2027–28 band is my view.
Lever two: builder capitulation. Builders can’t sit on frozen inventory the way homeowners can, so they cut: new-home prices have been falling while resale prices set records. New construction is where the negotiable deals are right now, and where the first cracks in seller pricing appear.
Lever three: time. Incomes grind higher every year while the payment stays flat. This is the slowest thaw, but it’s always working in the background.
And the forward indicators, the windshield view again, suggest the thaw may already be starting. Weekly pending contracts are running at 75,856 versus 72,039 a year ago, up about 5.3% (calculated), and purchase applications opened 2026 up 13% year over year (HousingWire). Housing analyst Logan Mohtashami, whose weekly demand data I trust precisely because it leads closed sales by one to three months, thinks total 2026 sales could approach five million (Benzinga). Against Fannie’s 4.76 million forecast and last year’s roughly 4.74 million (calculated: 4.06M existing + ~0.68M new), that would be the first meaningful volume growth in four years.
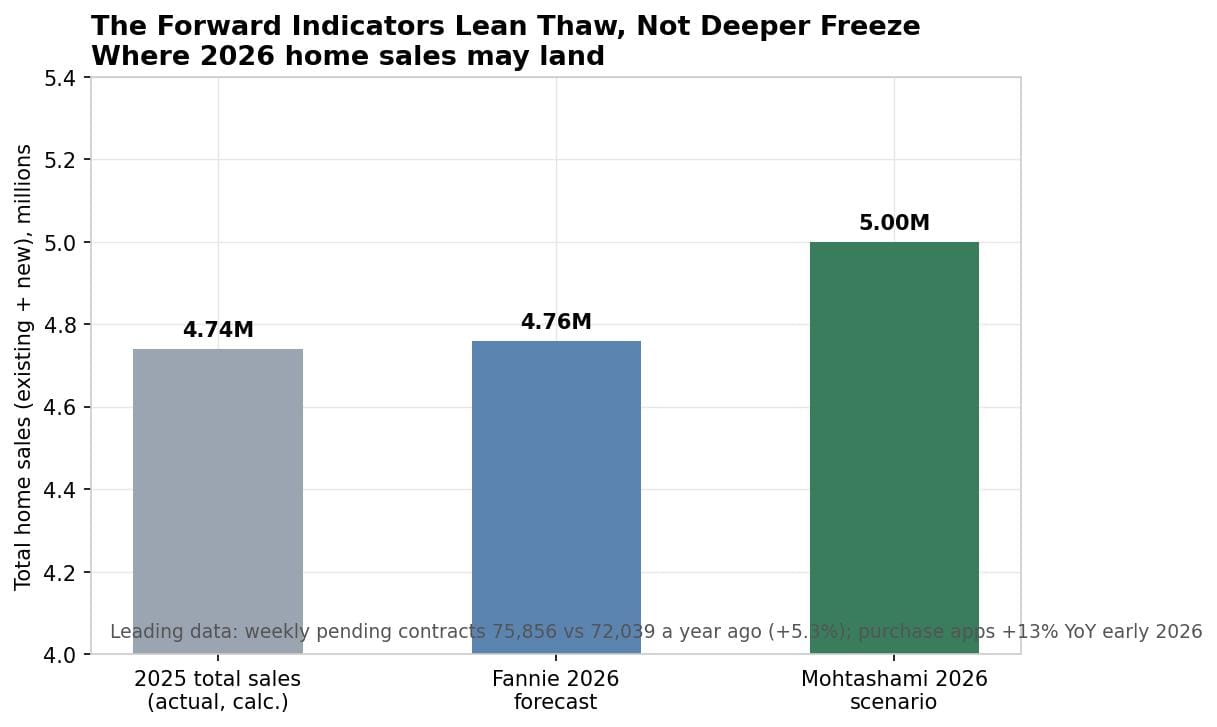
Sources: Fannie Mae, HousingWire/Mohtashami; 2025 total calculated.
The steelman: Counterpoint time again.
Frozen markets can break downward instead of thawing. Inventory is building toward six months in a growing list of metros, builders are already cutting, and if the labor market cracks, forced sellers meet a thin buyer pool and the standoff resolves in price declines, not volume recovery. Japan’s property market spent a decade proving that “frozen” can simply mean “slowly deflating.” The honest counter is the labor market: unemployment is 4.2% (BLS), and without forced sellers there is no mechanism for capitulation. Watch jobs. If unemployment starts climbing month after month, and remember, that means a trend, not one report, the freeze thesis needs rewriting.
What It Means for Investors
A frozen market is not a dangerous market: it may be the most negotiable market in years. Thin volume means the sellers who must move, the relocations, the estates, the tired landlords, face a shallow pool of buyers, and that is where deals get made. Meanwhile the rental side quietly pays you while you wait: rent, loan paydown, tax benefits, appreciation, and leverage don’t need transaction volume to work. Those five engines are the entire subject of my book on how real estate actually builds wealth, and frozen years like these are exactly when the non-price engines carry the load.
Nashville: The Engine Under the Ice
The freeze is national. Nashville shows why a strong jobs market is the most important measure for local housing/renting/land-lording.
The Nashville metro labor market is one of the healthiest in the country.
Davidson County unemployment sits near 3.0%, and Tennessee has held 3.6% for four straight months.
Both are comfortably below the national 4.2% (TN Dept. of Labor).
Forecasters project the metro to add roughly 31,400 jobs in 2026, growth of about 0.9%, nearly double the national pace (Boyd Center; USAFacts).
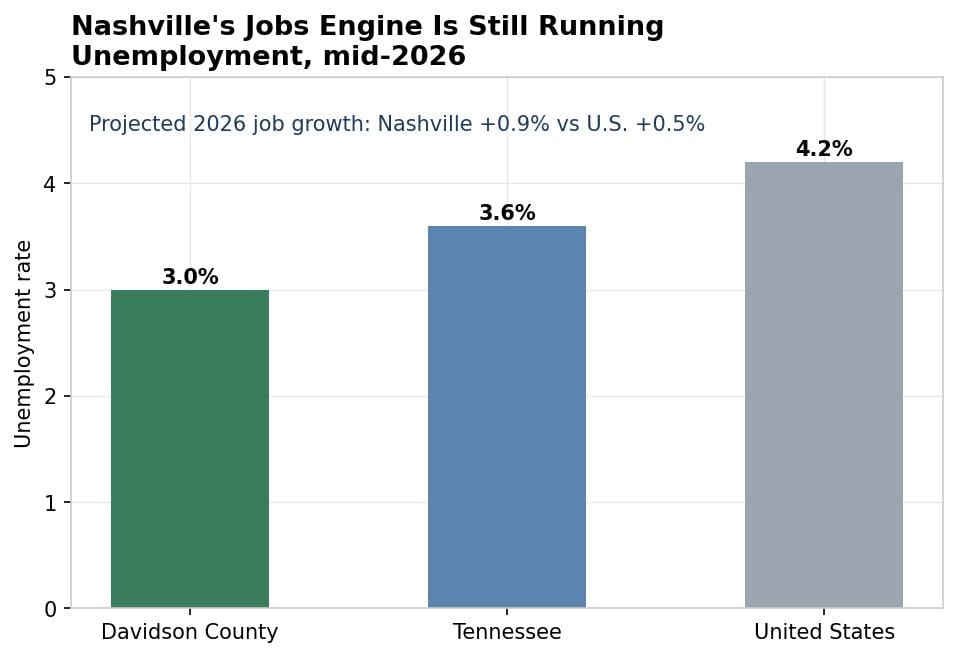
Sources: TN Dept. of Labor & Workforce Development, BLS, Boyd Center.
Remember the steelman above: frozen markets break downward when forced sellers appear, and forced sellers come from job losses. A town where nearly everyone who wants a job has one produces very few forced sellers. Record prices on six months of inventory is a standoff, and the jobs engine is what keeps the standoff from becoming a rout.
Prices are still on their way up here in a slow, steady, and healthy way.
My Skeptical Take:
Markets punish impatience, and frozen markets punish it doubly.
Three years into the freeze, the loudest voices have been wrong in both directions: the crash-callers and doomers who promised 2008 every autumn, and the boom-callers who promised rates back at 4% every spring.
What actually happened was more boring and instructive: volume died, prices held, landlords got paid, and the market slowly built the conditions for its own thaw.
Real estate keeps on chugging.
Now the forward indicators - cooling core inflation, oil giving up its war premium, weekly purchase demand quietly rising - do appear to be leaning toward that thaw.
Not a boom, but a drip. And drips are easy to miss if you’re tilting on headlines after one poor month.
Peter Lynch, who compounded at 29% a year while everyone around him panicked over headlines, put it best:
“The real key to making money in stocks is not to get scared out of them.”
Swap “stocks” for “real estate” as your asset of choice and you have the operator’s playbook for a frozen market: don’t get scared out by one ugly month, don’t get lured in by one hot one, watch the trend, watch the forward data, and be the patient buyer in a market full of nervous ones.
In fact, the savvy investor uses this for their next buy.
Market is lookin good, keep on drippin’.
Until next time. Stay Curious. Stay Skeptical.
Herzliche Grüße,
-The Skeptical Investor