Energy Prices have peaked. Rents Are Turning. Nashville Is Booming.
Today’s Interest Rate: 6.32%
(☝️ .03% from this time last week, 30-yr mortgage)
This week, we’re talkin’ ebbing gas prices, stagnant diesel prices, a strong jobs report, and the corporate migration story here in Nashville.
Let’s get into it.
The Weekly 3 in News:
DOJ drops Powell investigation Friday Apr 24 — Paving the way for new Fed Chair to be confirmed on time, with an eye toward lowering interest rates this Summer (Yahoo Finance, Apr 24)
US Shipping Crude Oil Straight to Japan - The tanker OTIS unloaded roughly 910,000 barrels of Texas light oil at a refinery near Tokyo through the Panama Canal, avoiding the Strait of Hormuz (JapanTimes).
Japanese companies are buying US homebuilders. Back in 2015, Japanese owned builders had around 0.2% of the market—by 2025, that figure had risen to 4.8%. They are now buying 4 more! (Zonda, ResiClub).
A Few Fun Things Happening in Nashville This Week:
Nashville Sounds vs. Norfolk Tides — First Horizon Park, Friday May 1 at 6:35 PM. Triple-A baseball at the Germantown ballpark, walking distance from the neighborhood’s restaurants. (Nashville-tn.events)
Florence + the Machine, “Everybody Scream” Tour — coming through Nashville this spring. Big-ticket pop/indie show with Rachel Chinouriri, Sofia Isella, CMAT, and Mannequin Pussy supporting. (Nashville Theatre Concerts May 2026)
Inflation Picture: Energy Costs Are Still Elevated
Eight weeks into the US-Iran conflict, the energy picture is now much more clear:
As long as oil supply coming out of the Gulf is constrained, we will be paying ~$1/gal more for gas (and also diesel, jet fuel etc…).
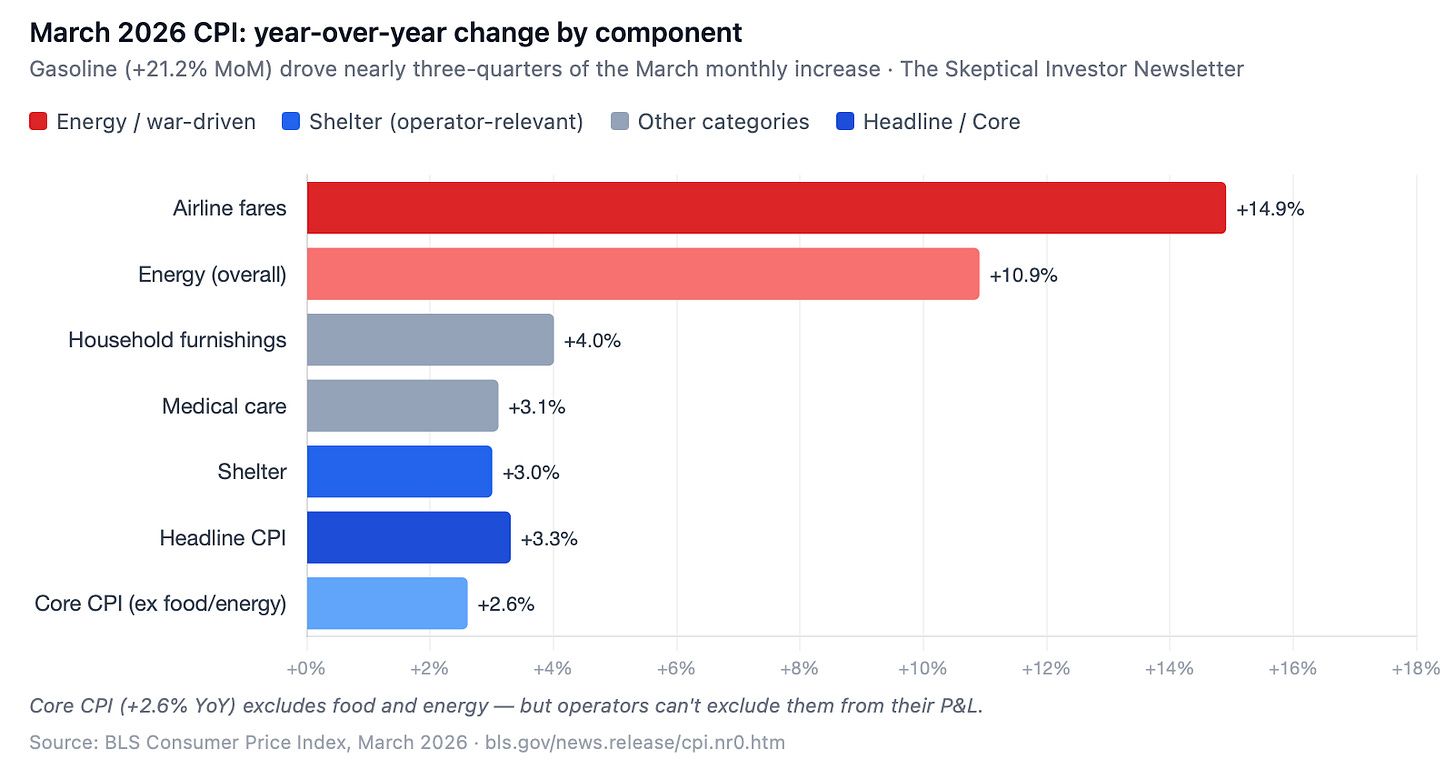
So far, gasoline is up 35% since Feb 27th (or $4.02/gal, down from $4.12/gal April 14th), driving headline inflation (CPI) to +3.3% YoY — up from 2.8% in February. This means any business who consumes these products will see higher input costs.
BUT…So far…
…Core CPI — everything except food and energy — has been well-behaved, at +2.6%.
There has yet been no transmission from energy prices into core goods inflation. Meaning the oil price shock may not automatically become sticky, broad inflation. It stays in the energy bucket, makes a mess for a few months, and then fades. Compare this to other inflation shocks, like 2021-2022, when inflation spread into everything from lumber to laundry detergent.
Treasury Secretary Scott Bessent reiterated this point on CNBC last week, saying “Markets live in the future. This war will end — three days, three weeks, or three months — and we’ll get to the other side of it. What matters is the data: core inflation is clearly coming down. The energy component is noisy, but we’ve already seen oil prices collapse over the past two weeks, and there has been no transmission from energy into core goods (Bessent).”
We can see this in interest rates, which have restarted their decline back toward 6% (more on that later).
In other words, we may have weathered much of the storm.
Diesel is Different
We can’t pretend that higher diesel prices don’t matter for us real estate investors, which are up 50% to $5.62/gal. And will remain elevated for longer.
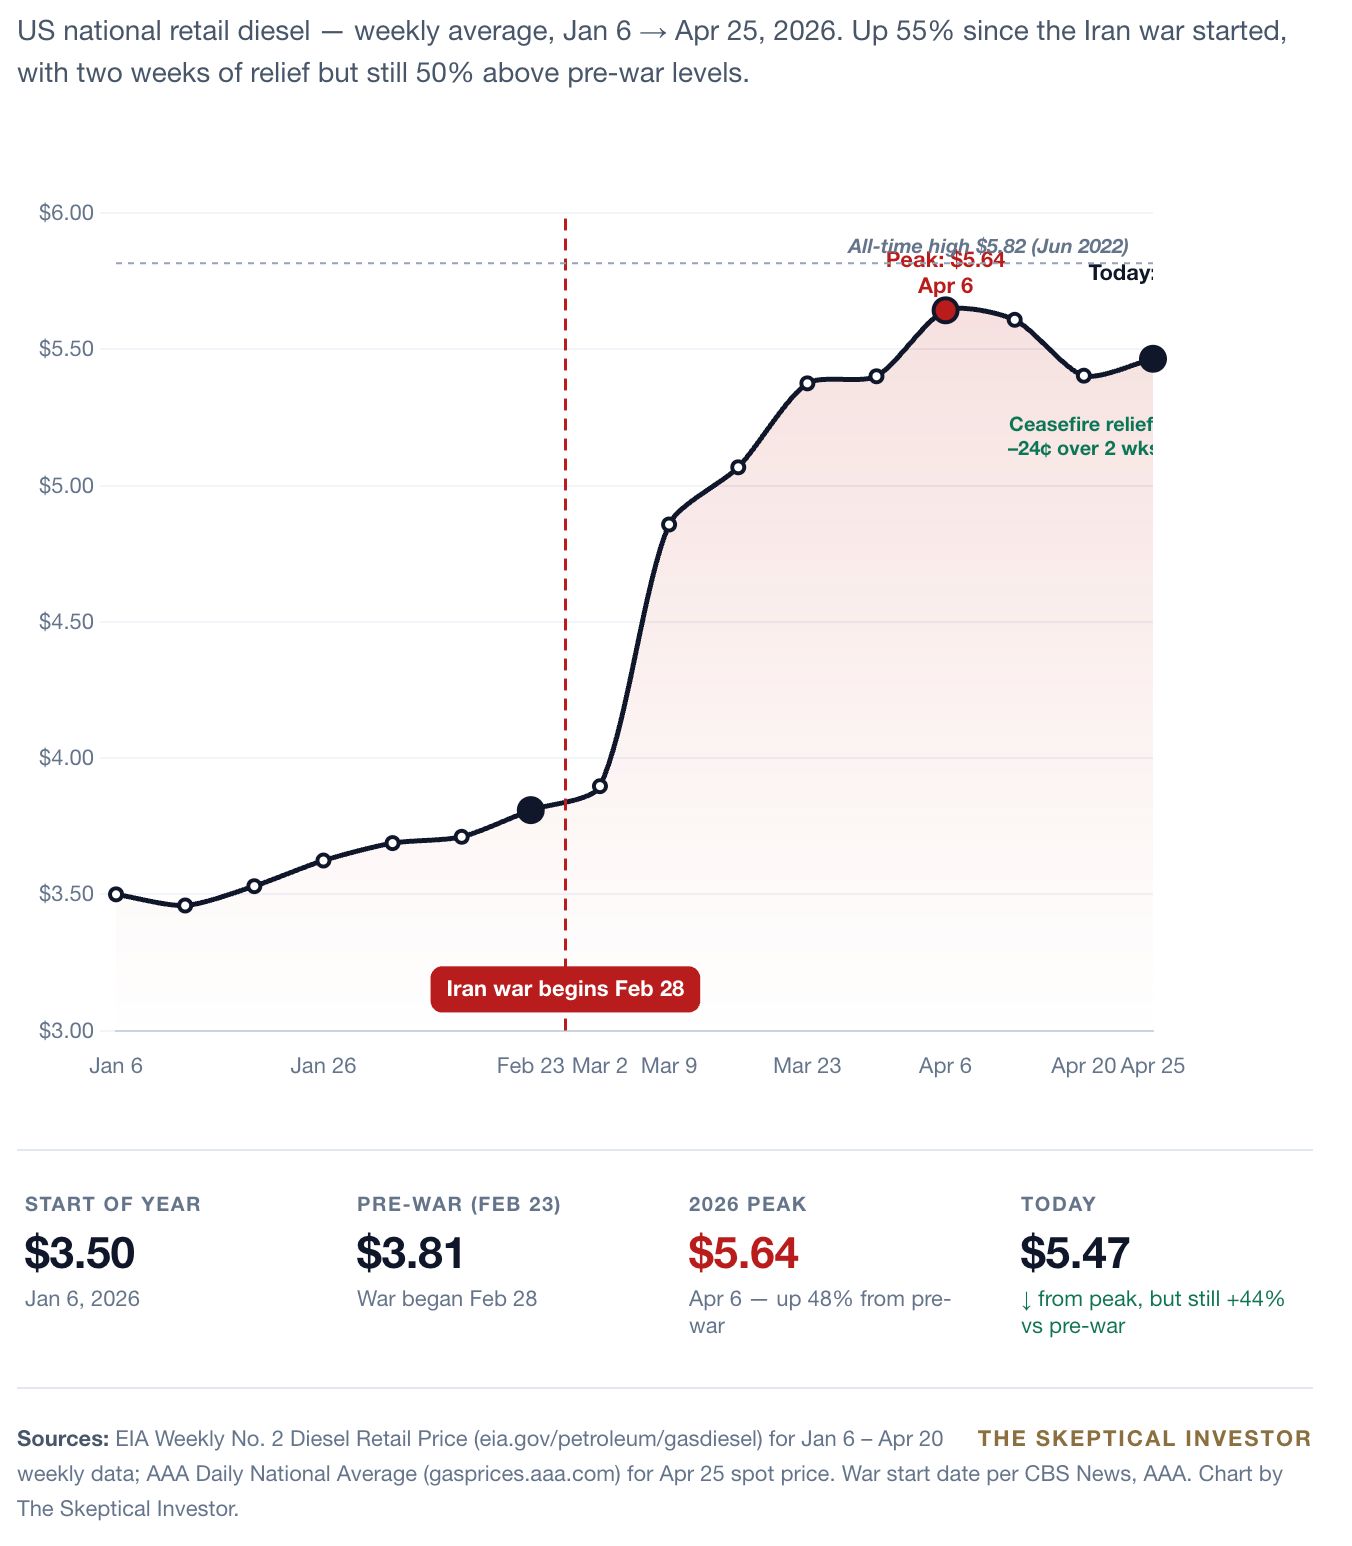
Now they have come down ever so slightly (2%) in the last 2 weeks, but not much.
Why?
Diesel demand is structurally inelastic — it powers freight, agriculture, construction. Trucks have to keep moving regardless of price, so refiners don't need to discount as aggressively as supply eases.
Building materials ship on trucks. Your contractor/handyman maintenance crew burn fuel getting around.
Hell, one of my contractors just leased 2 Tesla Y cars for his crew and told them to leave their trucks at home for daily use.
If you haven’t already had a conversation with your vendors about where their pricing is heading, have it this week. 62% of homebuilders told NAHB this month that suppliers have already raised prices due to higher fuel costs.
This is not theoretical.
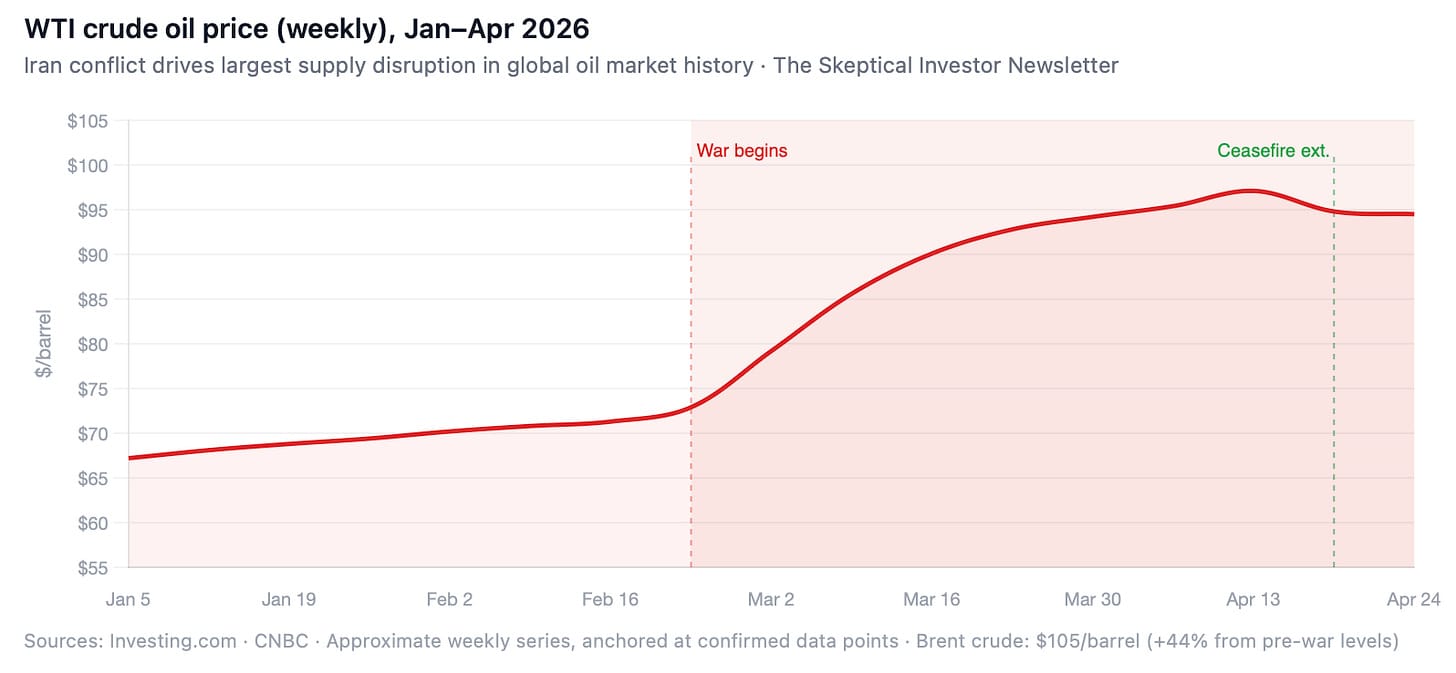
Where are fuel prices going? Oxford has a guess
The ceasefire was extended on April 21st. Oil continued to pull back. Oxford Economics is modeling prices to drift lower through the back half of 2026 as the conflict stabilizes — and markets seem to agree, given that the S&P 500 closed the week at 7,137.90, an all-time high.
The Jobs Report Actually Came in Strong
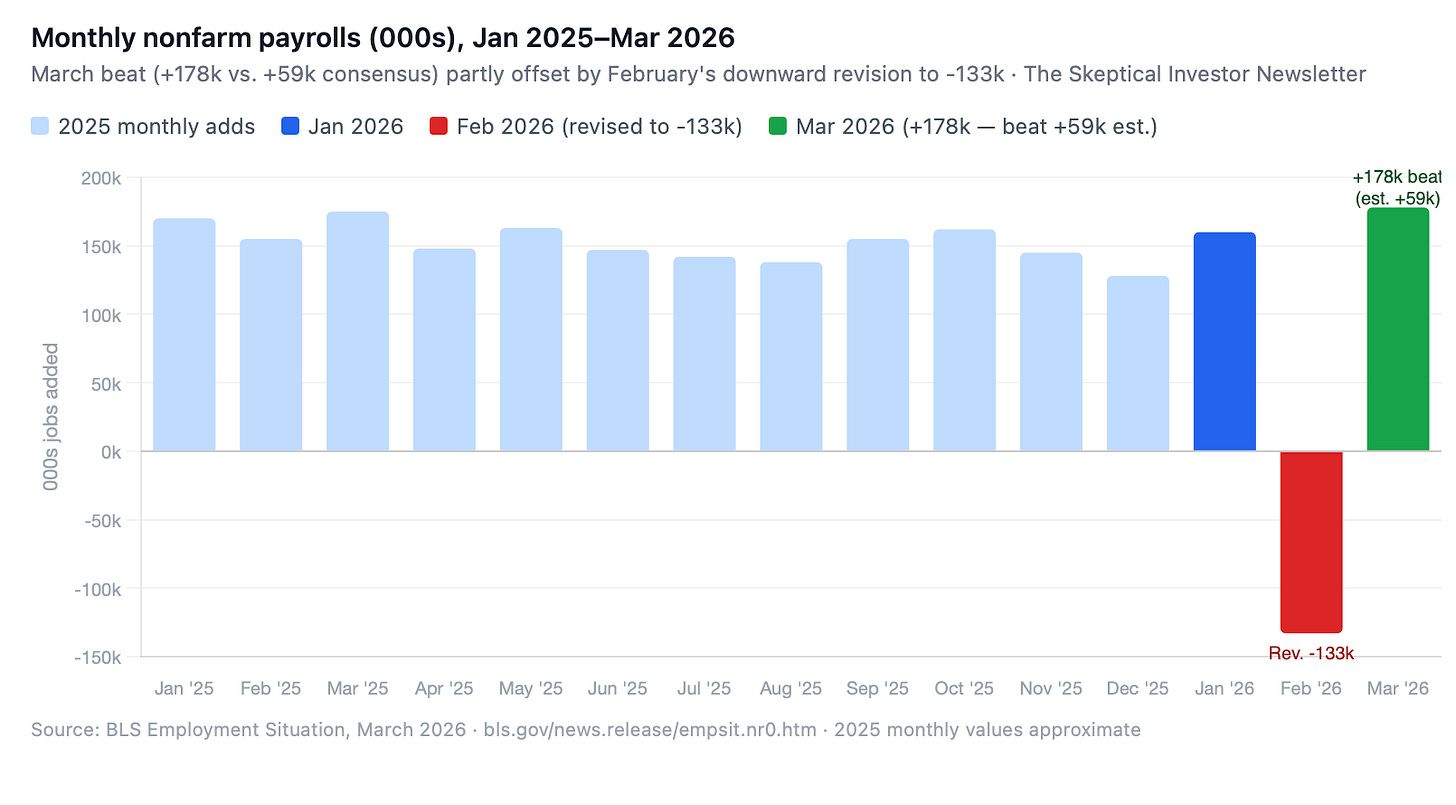
March nonfarm payrolls added +178,000 jobs. The Dow Jones consensus estimate was +59,000.
It beat by 3x!
That’s not a small miss — that’s the analysts getting it wrong in a big way, and it tells you something about how much pessimism was already baked into expectations.
There is a lot of noisy pessimism out there.
What industries stood out?
Health care led with +76,000 jobs. Construction added +26,000. Transportation and warehousing added +21,000. The unemployment rate held at 4.3%. People have jobs. Employed people pay rent. That’s the chain that matters.
Yes, February was revised down to -133,000 — that’s worth keeping in mind when you think about the 3-month trend. The labor market is still in a tenuous position. But a labor market that prints +178k against a backdrop of a war in the Middle East where the primary oil supply is highly constrained and consumer confidence is still at an all-time-low is demonstrating real underlying economic durability.
The Fed is sitting at 3.50-3.75% and markets are pricing in one more 25bp cut — most likely September or October. Slower than anyone hoped a year ago. But rates are going down, not up, and every cut that comes puts more deal math in the black.
Rents Just Posted Their First Monthly Gain Since Last Summer
I was reading the Yardi Matrix Q1 multifamily report again and let me tell you what caught my eye.
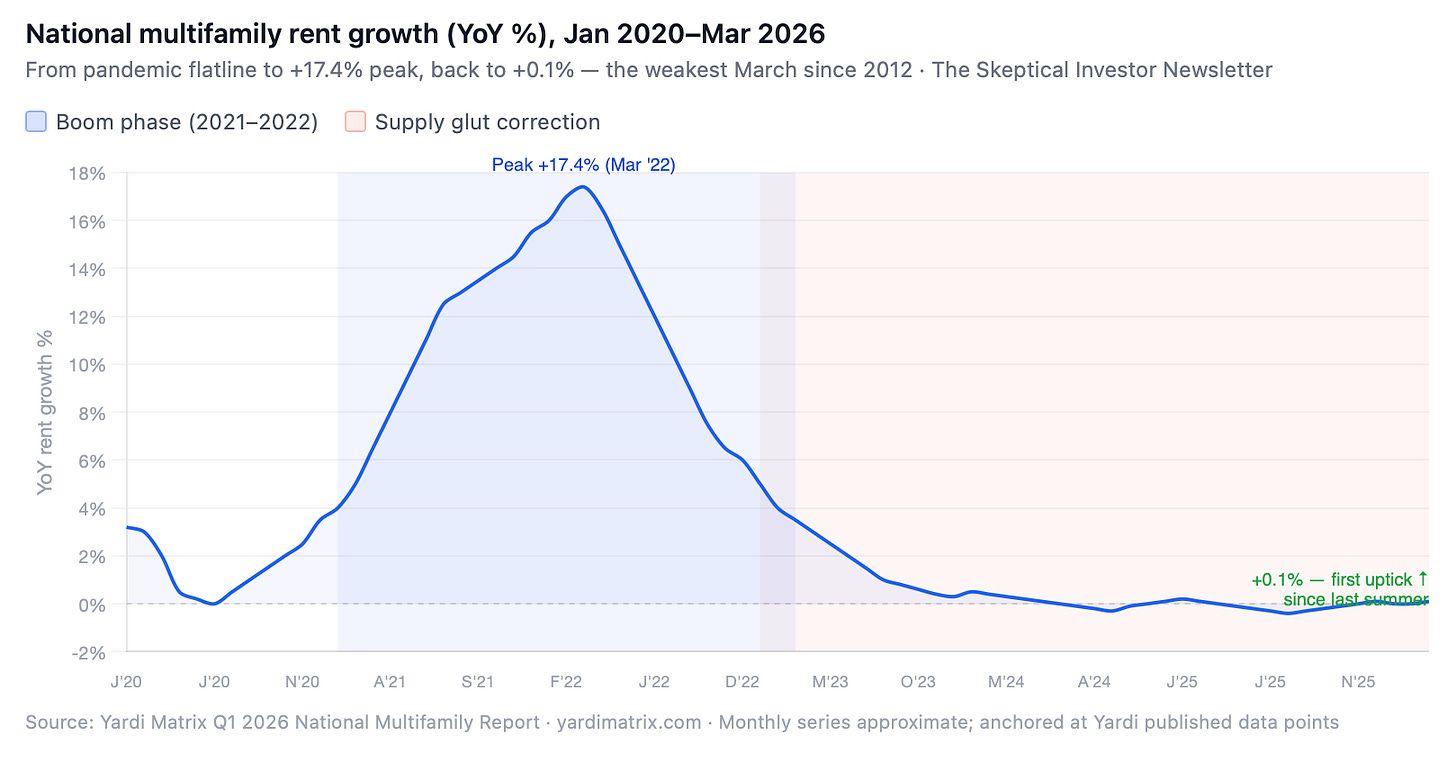
National rents rose in March.
The average advertised rent climbed $5 to $1,750 — the sector’s first monthly gain since last summer.
That’s not a headline that gets a lot of play, but to anyone who has been watching this market closely for the past 18 months, it matters.
Why?
The supply wave is cresting (yes yes I’ve written about this many times before but I feel like my fellow investors just aren’t thinking about this enough).
In 2024, roughly 600,000 apartment units were delivered nationally — a historic flood of new supply that was always going to compress rents. In 2025 that fell to around 455,000. In 2026, Yardi projects 415,000 to 441,000 units — still historically elevated, but the trend is unmistakably downward.
The construction pipeline is draining. New starts are declining. The builders who greenlit projects during the 2021-2022 frenzy are finishing their delivery.
Here’s how I think about it: at 415,000 annual deliveries against typical annual apartment demand of 300,000-400,000 units, we’re roughly at equilibrium nationally— which means any incremental demand growth from here tips the scale toward landlords.
And as supply continues downward, demand is picking up.
Pending Home Sales and Mortgage Applications are UP
Last week’s pending home sales data came in at 80,258 — a multi-year high for that calendar week. Compare that to the same week in 2025: 67,892.
That’s an 18% year-over-year increase.
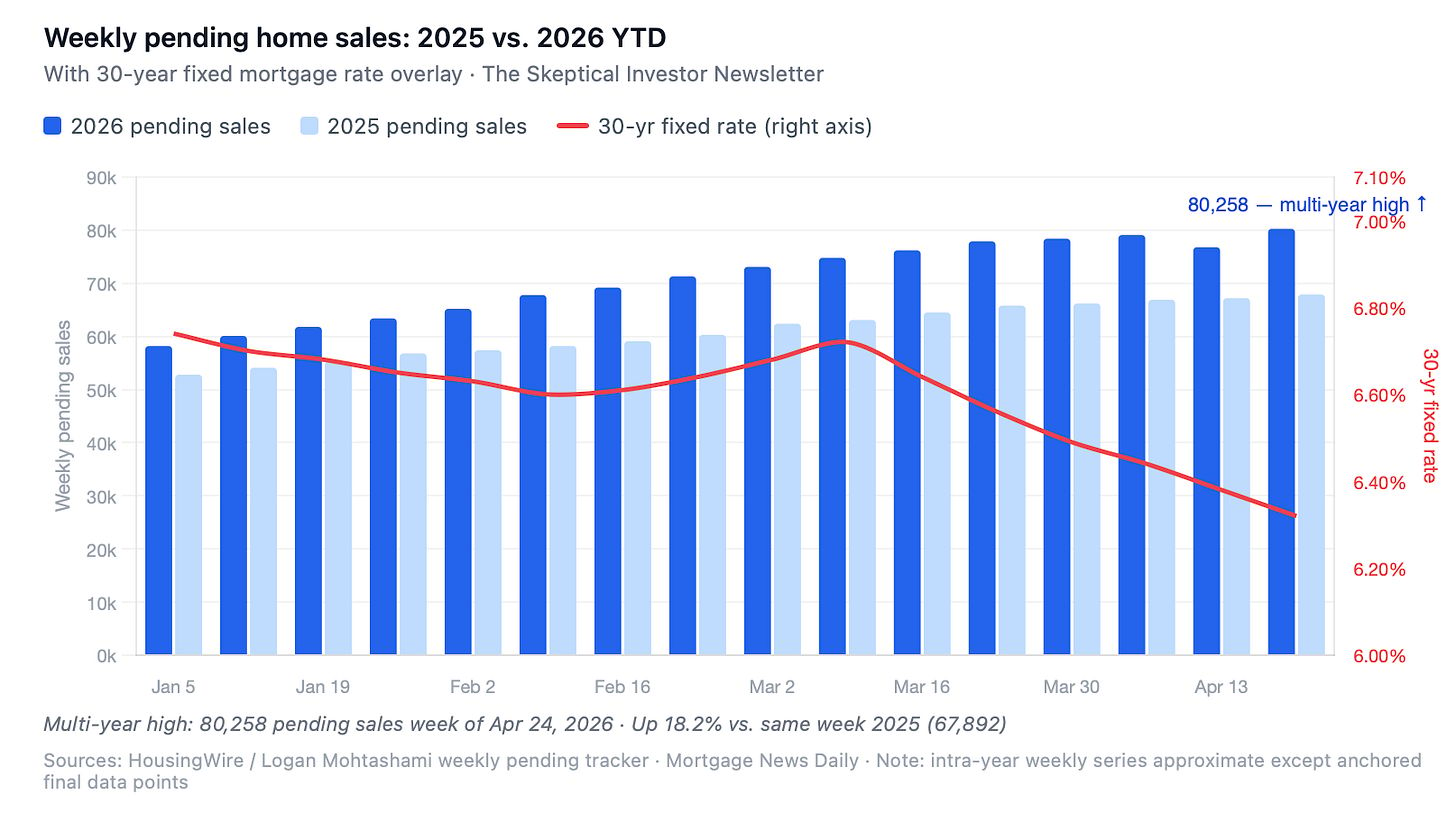
Logan Mohtashami at HousingWire has been tracking this data meticulously, and the pattern is real. Pending sales are a leading indicator — they typically hit the official sales data 30 to 60 days later. So what you’re seeing in pending sales today is what shows up in June and July transaction numbers.
Historically, pending sales data has been most responsive when the 30-year fixed rate dips below 6.25%. We’re at 6.23-6.32% right now — right on the edge of that sweet spot. If rates continue drifting lower, this data could get even better.
And, guess what?
Purchase applications were up 10% week-over-week and 12% year-over-year in the latest MBA data.
That’s a meaningful snapback after a stretch of softness driven by rates briefly touching 6.64% earlier this month, driven by inflation fears.
In the last 2 months, we have had 7 positive week-over-week prints, 7 negative, and 1 flat — so basically even on the weekly rhythm.
But the year-over-year picture is what catches my eye: 8 weeks of double-digit YoY growth and 13 total weeks of positive YoY growth in 2026. Two negative YoY prints. The demand signal is durably positive at the annual comparison level.
Purchase applications lead actual home sales by roughly 30 to 90 days. You’re looking at the future when you read this data, not the present.
New Listings: Finally Returning to Normal
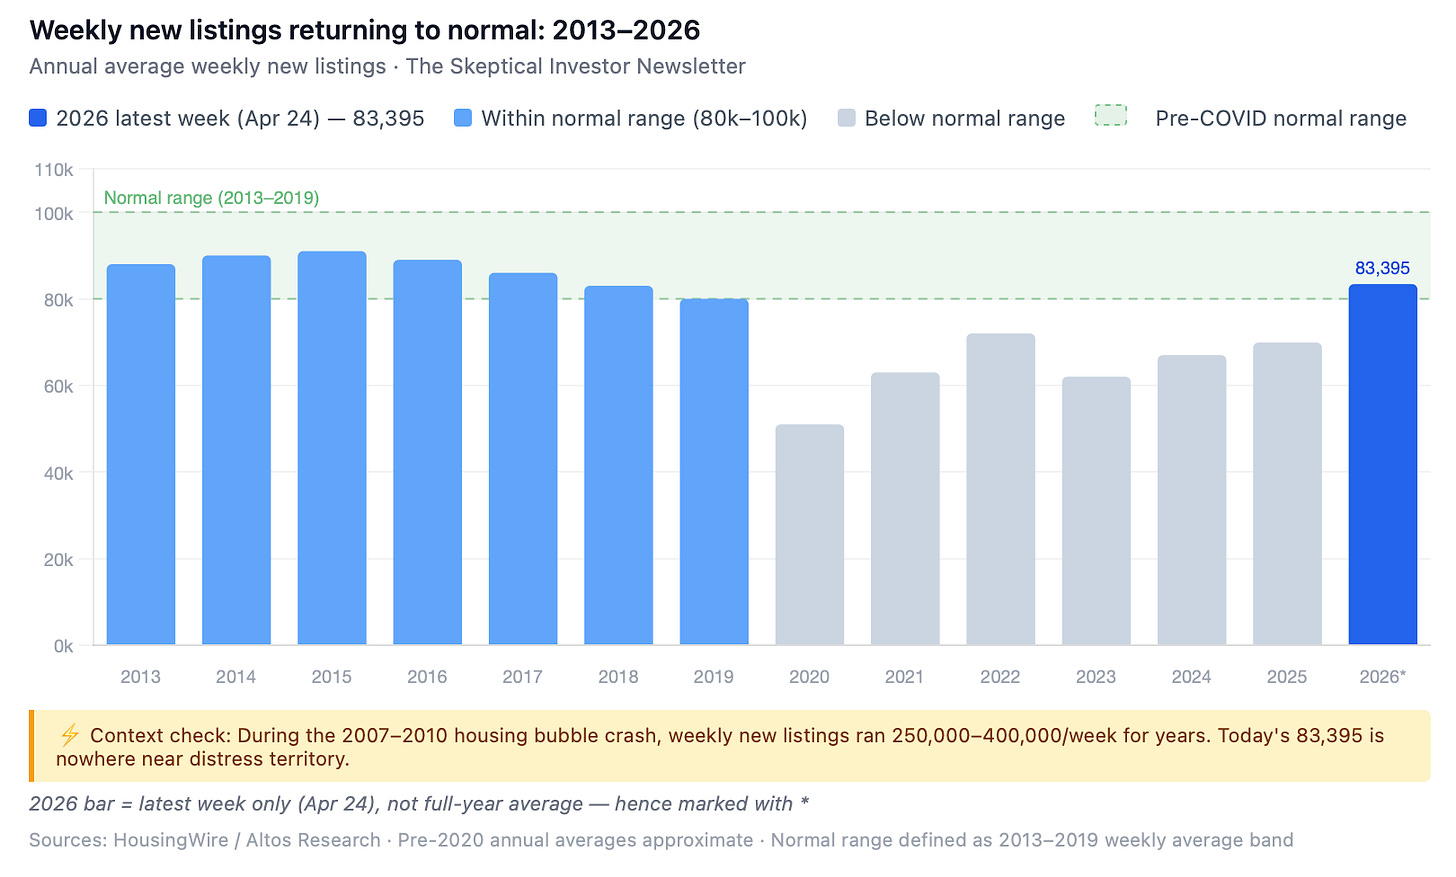
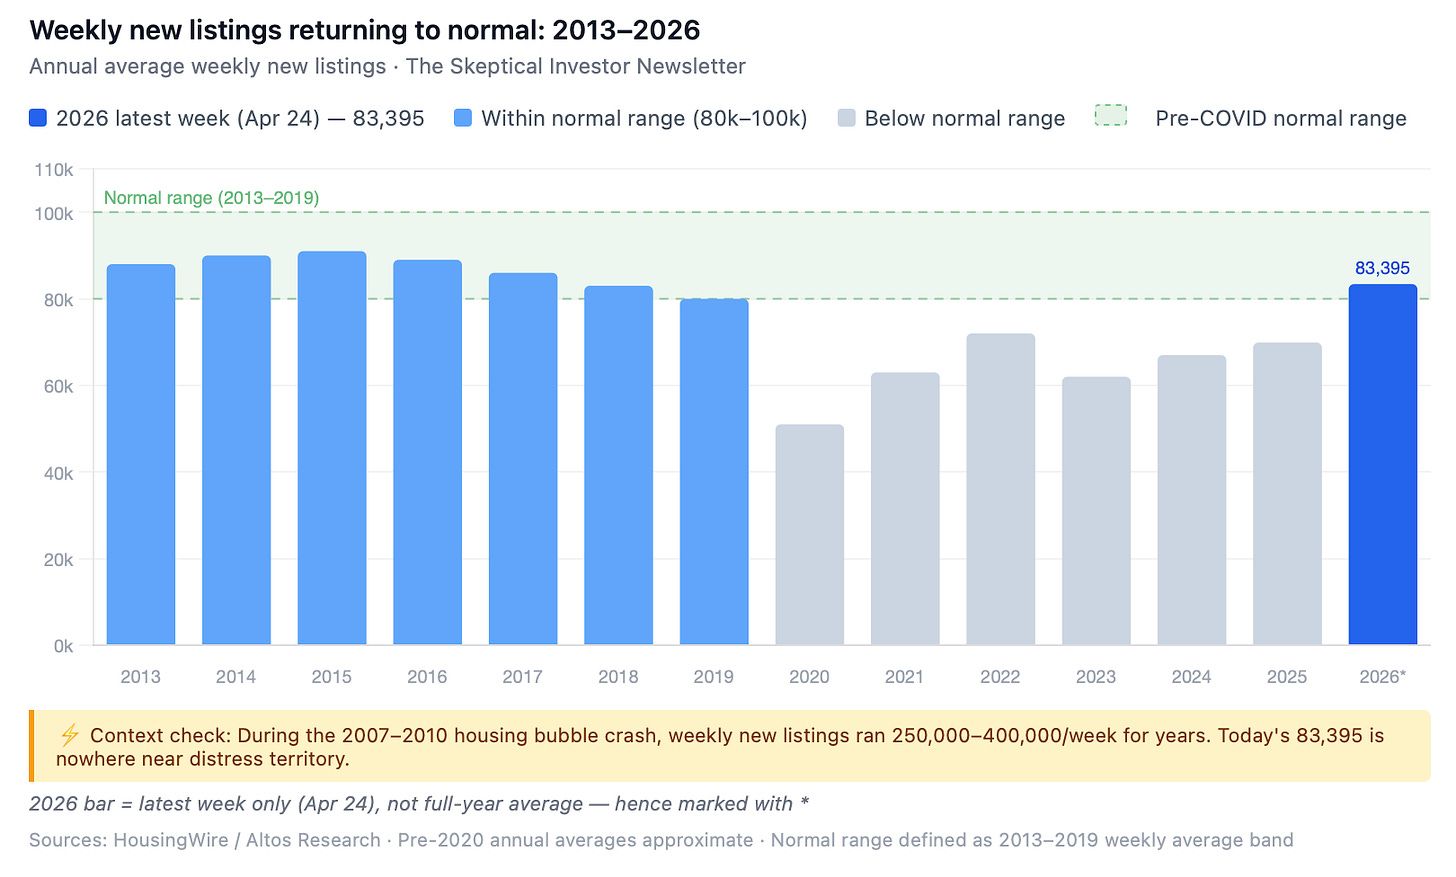
This one deserves a moment: New listings last week came in at 83,395 — versus 69,891 for the same week in 2025, a 19% year-over-year increase.
We finally got above the 80,000 weekly threshold. Between 2013 and 2019, normal new listings ranged between 80,000 and 100,000 per week. The pandemic and the subsequent lock-in effect crushed that range for years. Last year we briefly got above 80,000 but couldn’t sustain it. This week we broke through and — hopefully — build from here.
For anyone inclined to panic when new listings rise: don’t.
During the actual housing bubble crash of 2007-2008, new listings were running 250,000 to 400,000 per week for years on end. We are nowhere near that. A healthy, normal listings market is good for everyone — it means buyers have options, transactions happen, and the market doesn’t seize up.
Inventory: Growing, But Not Collapsing
Total active inventory rose from 743,006 to 765,048 in the week of April 17–24. The same week last year, inventory rose from 719,403 to 728,758. Year-over-year, inventory is now up 4.98% — a big deceleration from the 33% YoY growth we saw at this time last year, but still growing.
Still healthy.
The important thing is direction. Earlier this spring, inventory was in danger of going year-over-year negative, which would have been a genuinely unhealthy signal. Instead, higher new listings — combined with strong demand absorbing a big chunk of that new supply — has kept inventory growth positive. You want a market where listings are coming in and getting absorbed at a reasonable clip. That’s what this is.
Price Cut Percentage: The Quiet Confirmation
Typically, about one-third of homes see a price reduction before they sell. Last week, the price cut percentage came in at 34.22% — versus 36% for the same week in 2025. Lower price cuts mean sellers have less incentive to discount, which means demand is meeting supply at or close to asking. This data has been running below last year’s levels for most of 2026, and it’s the quiet confirmation signal that supports the demand story.
Mortgage Spreads: The Hidden Tailwind
Here’s the one that most people completely miss, and it’s worth spending a minute on.
Mortgage rates are currently around 6.32%. That sounds like a lot compared to the 3% pandemic-era rates everyone is still mourning. But here’s what matters: those rates exist against a 10-year Treasury yield that was recently sitting at 4.48%. The spread between the 10-year and the 30-year mortgage rate is what determines how much of the Treasury yield passes through to borrowers — and that spread has been compressing meaningfully.
Last week, mortgage spreads closed at 1.93%, down from 2.00% the prior week. The historical norm is 1.60%–1.80%, so we’re still a little wide — but the direction is right. And here’s the comparison that really drives the point home:
If we had the worst spread levels of 2023, the 30-year mortgage rate today would be 7.50% — not 6.32%.
At 2024’s worst spread levels, rates would be 7.12% today.
At 2025’s worst levels, rates would be 6.93% today.
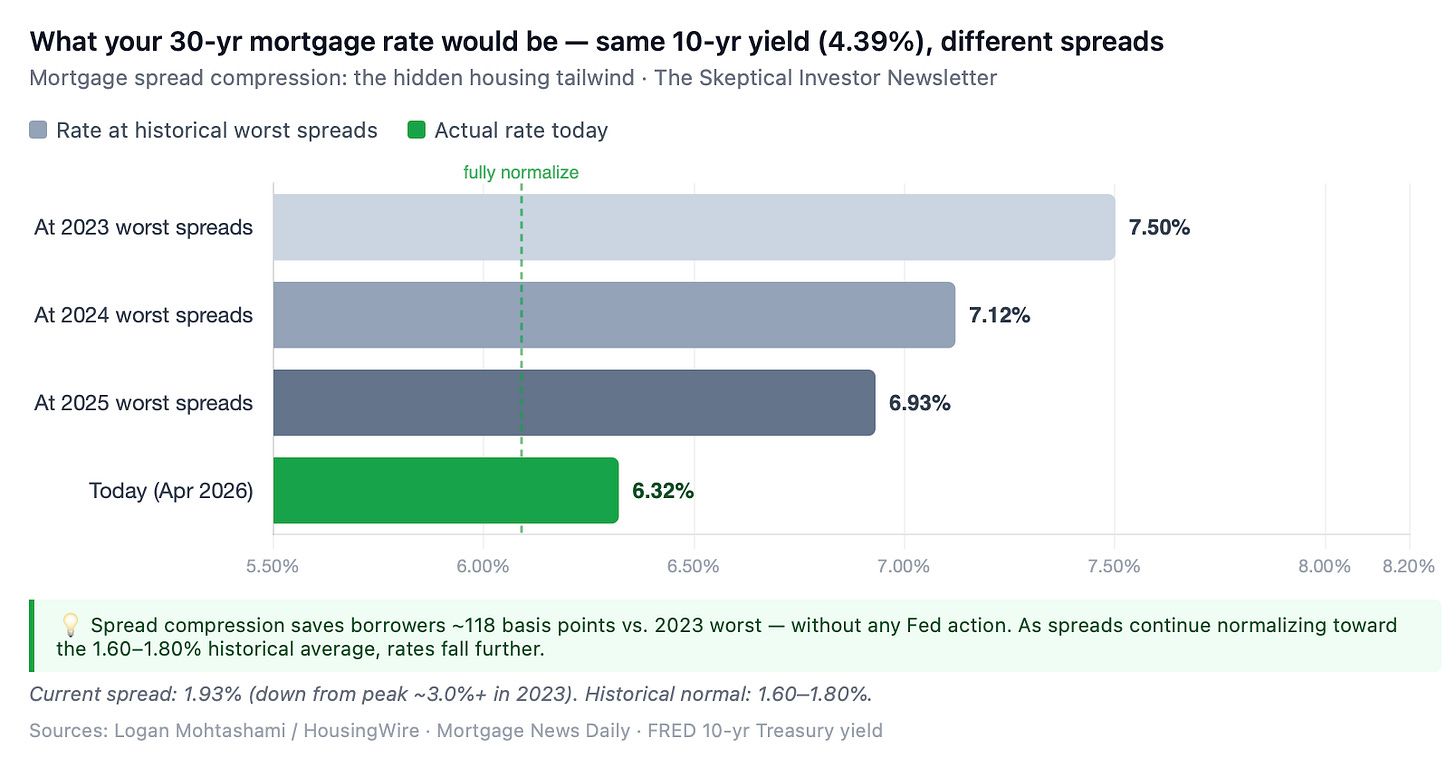
Spreads tightening is a structural tailwind that most housing market coverage completely ignores. It means borrowers are getting more rate relief than the 10-year Treasury would suggest they “should.”
As spreads continue normalizing toward the historical 1.60%–1.80% range, we could see the effective mortgage rate fall meaningfully — without the Fed doing anything at all.
Bullish.
My Skeptical Take:
The energy spike is real, but it’s temporary.
Energy prices are elevated, but rents are starting to turn, builders are pulling back, and demand for housing is picking up again.
We’ve got: pending sales at multi-year highs. Purchase apps positive YoY. New listings finally normalizing. Inventory growing but not flooding. Price cuts running lower than last year. Mortgage rate spreads compressing.
This is a positive environment for investors.
The scared-consumer headline will pass. Geopolitical shocks always do. The fundamentals — employment, household formation, constrained supply — are durable.
What’s more, if consumers are scared, they rent.
The investors who position themselves during the periods of anxiety are the ones who look very smart when things normalize. Experienced folks manage through higher costs by knowing their numbers and passing along what they reasonably can.
The investors who get hurt by cost spikes are the ones who were underwriting too thinly. Keep your numbers tight and stay away from any rosy assumptions.
This market is nothing to be scared of.
Until next time. Stay Curious. Stay Skeptical.
Herzliche Grüße,